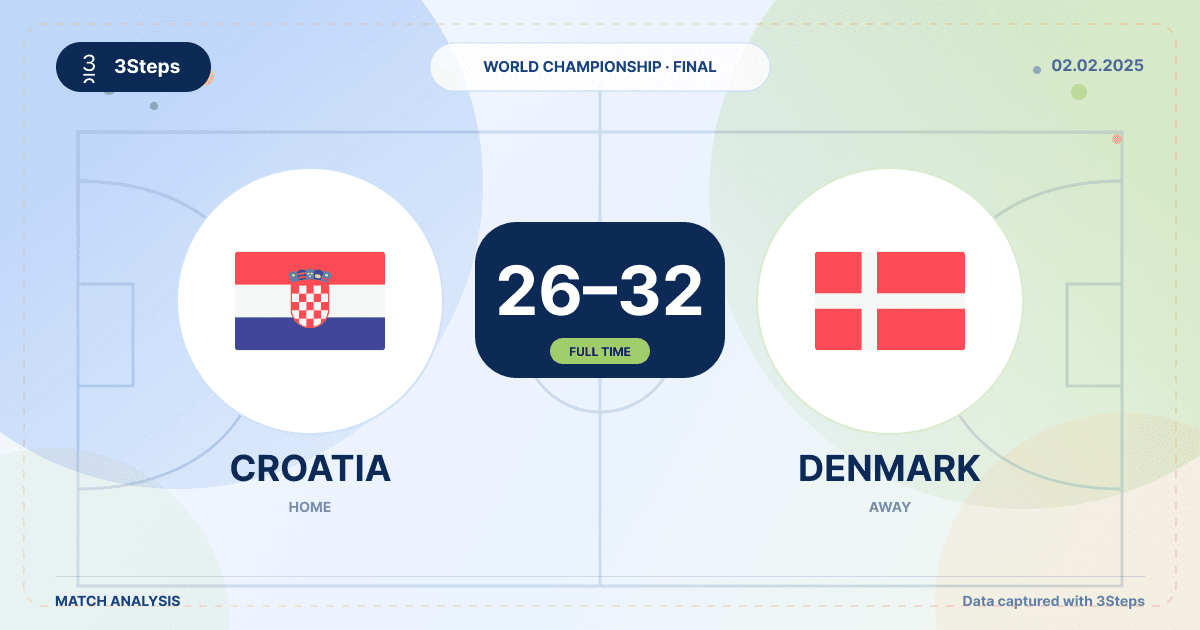
Denmark beat Croatia 32–26 in the World Championship final on February 2, 2025. The final score tells who won, but the match statistics provide a better picture of why Denmark gained the upper hand.
The analysis is based on events registered with 3Steps: 168 main events and 290 events when related registrations are included. The figures particularly point to differences in shooting efficiency, goalkeeping, and the ability to create good opportunities for teammates.
The match in brief
Denmark scored on 32 out of 40 shots, ending with an 80 percent success rate. Croatia scored 26 times on 45 shots, equivalent to 57.8 percent. Denmark thus got more value from fewer shots.
Team | Goals | Shots | Shooting Percentage | Assists |
|---|---|---|---|---|
Denmark | 32 | 40 | 80 % | 12 |
Croatia | 26 | 45 | 57.8 % | 9 |
Denmark also converted 7 out of 8 seven-meter throws, while Croatia recorded six technical errors. The numbers alone do not explain all situations, but they show where Denmark gained several small advantages throughout the match.
The goalkeeping difference became clear
Emil Nielsen delivered the strongest goalkeeping performance of the match with 14 saves on 35 shots on goal. This resulted in a save percentage of 40. Particularly the success rate against shots from six meters and from the wing stood out in the recorded data.
Goalkeeper | Team | Saves | Shots on Goal | Save Percentage |
|---|---|---|---|---|
Emil Nielsen | Denmark | 14 | 35 | 40 % |
Jannick Green | Denmark | 1 | 5 | 20 % |
Dominik Kuzmanović | Croatia | 3 | 23 | 13 % |
Ivan Pešić | Croatia | 1 | 11 | 9 % |
Nielsen saved 11 out of 29 shots from six meters, both recorded wing shots, and one out of three shots from nine meters. The Danish goalkeepers had a total of 15 saves, while the Croatian goalkeepers had four.
This does not mean that goalkeepers can be assessed independently of the defense. Shot pressure, angle, blocks, and which shots the team allows always affect the goalkeeper's working conditions. Nevertheless, the difference is so significant that goalkeeping becomes an important part of the match picture.
The players who made the biggest impact on the match
Mathias Gidsel combined high shooting efficiency with four assists and one second assist. Simon Pytlick contributed six assists, while Lukas Jørgensen had a perfect success rate on his three shots and delivered contributions in defensive play.
Player | Team | 3Steps Score | Shots | Assists | Other Contributions |
|---|---|---|---|---|---|
Mathias Gidsel | Denmark | 12.21 | 10/11 | 4 | 1 second assist, 1 stolen ball |
Simon Pytlick | Denmark | 7.22 | 4/5 | 6 | 1 second assist |
Lukas Jørgensen | Denmark | 5.03 | 3/3 | – | 3 tackles, 1 block |
Marin Jelinić | Croatia | 5.30 | 3/3 | – | 5 tackles, 1 stolen ball |
Mario Šoštarić | Croatia | 5.11 | 5/6 from play | – | 2/2 on seven-meter throws, 1 tackle |
Gidsel's five technical errors simultaneously show why a player's performance should be evaluated with more numbers than goals alone. A player can be decisive offensively and still have situations the team should work on further.
Three questions the coaching staff can take with them
- What did Denmark do to achieve such high-percentage shots, and which of these situations can their team recognize?
- How did the Danish defensive work connect with Emil Nielsen's saves? Look at shot pressure, angles, and where the shots came from.
- Which turnovers, technical errors, or suspension situations changed the rhythm of the match, and could any of them have been avoided?
These are questions that make statistics actionable. The goal is not just to describe the match, but to use the numbers to find situations worth re-examining.
The numbers need match context
The analysis covers one match. It therefore does not alone determine who is the best player or goalkeeper over time. Percentages are also affected by the number of attempts, shot types, and the quality of the situations.
Use the tables as an entry point to video and handball-specific evaluation. When numbers and situations point in the same direction, the coaching staff gains a much better basis for learning than by looking at the final score alone.
Watch the match on YouTube